GeekCoding101
Supervised machine learning trains a model on labeled examples, meaning inputs (x) paired with the right answers (y), so it can predict y for inputs it hasn’t seen. Day 1 of Andrew Ng’s Supervised Machine Learning: Regression and Classification splits it into two kinds of problems: regression (predicting a number) and classification (predicting a category). It then builds linear regression and the squared error cost function that tells you how well a line fits your data.
These are my notes from that first day, written as I went.
Day 1 at a glance
| Concept | One-line takeaway |
|---|---|
| Machine learning | Computers learn from data instead of being explicitly programmed |
| Supervised learning | Learn from labeled examples (x → y) |
| Regression | Predict a number from infinitely many possible values |
| Classification | Predict one of a small, finite set of categories |
| Unsupervised learning | Find structure in unlabeled data |
| Linear regression | Fit a straight line: f(x) = wx + b |
| Cost function J(w, b) | Measures how far predictions are from the true targets |
Why I Started This Course
I’ve been building an AI-powered product knowledge base chatbot on Django, LangChain, OpenAI, Chroma and Gradio. That’s the AI application/framework layer. I’ve also been looking at how to build a pipeline that assesses the accuracy of machine learning models, which is part of AI DevOps and infrastructure.
Then I realized I had no idea how to measure a model’s accuracy. That bothered me.
My first Google search was “how to measure llm accuracy”. It led me to Evaluating Large Language Models (LLMs): A Standard Set of Metrics for Accurate Assessment. It’s short and informative, and it opened a new world for me. It lists a standard set of metrics for evaluating LLMs:
- Perplexity: how well a language model predicts a sample of text. It’s the inverse probability of the test set, normalized by the number of words. Lower is better.
- Accuracy: correct predictions divided by total predictions.
- F1-score: the harmonic mean of precision and recall, so it balances both.
- ROUGE: how much generated text overlaps with reference texts. It’s common for summarization and paraphrasing, with variants such as ROUGE-N, ROUGE-L and ROUGE-W.
- BLEU: how closely generated text matches reference texts, based on overlapping word sequences (n-grams). It’s common for machine translation and image captioning.
- METEOR: another reference-based score that combines precision and recall to judge the quality of generated text.
- Question answering metrics: compare generated answers with reference answers. Accuracy (exact match) and F1-score are common.
- Sentiment analysis metrics: how well a model classifies sentiment. Examples include accuracy, weighted accuracy and macro F1-score.
- Named entity recognition metrics: how well a model identifies entities, measured with precision, recall and F1-score.
- Embedding similarity: when a model produces word embeddings, they can be compared with expected embeddings using methods like cosine similarity or Euclidean distance.
I didn’t know most of these, or where to start!
I had to tell myself: “Man, you don’t know machine learning…” So my next search was “machine learning course”. Andrew Ng’s Supervised Machine Learning: Regression and Classification came out on top. I’d heard of it before, since it’s famous.
I made a decision: take action now and finish it thoroughly. I enrolled right away. Let’s start the journey!
What Is Machine Learning?
Arthur Samuel defined it back in the 1950s 😯:
“Field of study that gives computers the ability to learn without being explicitly programmed.”
That last part is the key point. It answers a question a colleague once asked me: “What’s the difference between a programmed system that triggers alerts on events and an AI-powered system that also triggers alerts on events?” He couldn’t tell the difference, and that day I couldn’t find the right words to explain it.
Now I have them. The programmed system follows rules someone wrote by hand. The machine learning system learns its rules from data.
The Main Types of Machine Learning
- Supervised learning
- Unsupervised learning
- Reinforcement learning
Supervised Learning
Supervised learning learns from examples that come with the right answer (labels). It’s used for visual inspection, self-driving cars, online advertising, machine translation, speech recognition and spam filtering.
Regression: predicting a number
Example: house price prediction.
Regression means predicting a number from infinitely many possible outputs.
Classification: predicting a category
Example: breast cancer detection, where the output is malignant or benign.
Classification means predicting categories, and categories don’t have to be numbers:
- A model can predict whether a picture shows a cat or a dog.
- It can predict whether a tumor is benign or malignant.
Categories can be numbers, like 0, 1 or 0, 1, 2. What makes classification different from regression is that it predicts from a small, finite set of output categories, such as 0, 1 and 2. It never predicts the values in between, like 0.5 or 1.7.
The first cancer example uses only one input: tumor size. Classification also works with more inputs, like this:
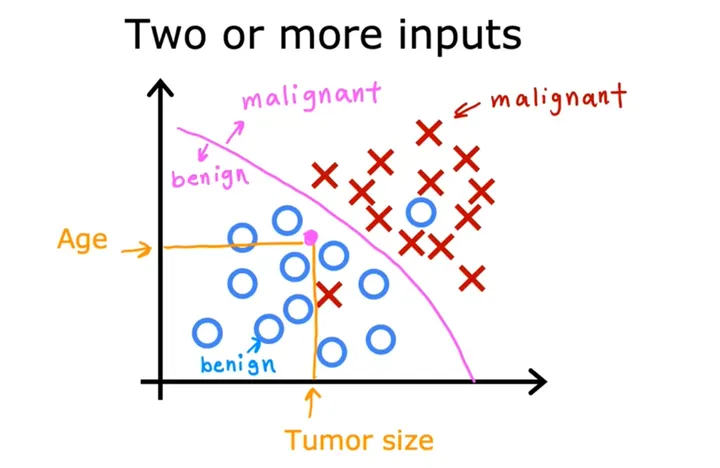
The key is to find the boundary between benign and malignant.
Unsupervised Learning
Unsupervised learning finds something interesting in unlabeled data.
Clustering
A clustering algorithm takes data without labels and automatically groups similar items into clusters. It does this by finding structure or patterns in the data. Google News uses clustering to group related stories.
Anomaly detection
Find unusual data points.
Dimensionality reduction
Compress data using fewer numbers.
Regression vs. Classification
| Regression | Classification | |
|---|---|---|
| Predicts | A number | A category |
| Possible outputs | Infinitely many | Small, finite set |
| Example output | 220,000 · 1.5 · −33.2 | cat / dog · benign / malignant · 0, 1, 2 |
| Example task | House price prediction | Tumor detection |
The Regression Model: Linear Regression
Back to the house example. Say you’re selling a house and want to predict how much it could sell for, so you build a linear model.
Any supervised learning model that predicts a number, such as 220,000 or 1.5 or −33.2, is solving a regression problem. Linear regression is one example of a regression model:
Or in a simpler form:
Now the question is how to find values for and so that the prediction is close to the true target for many, or maybe all, training examples .
The Cost Function: How Well Does the Line Fit?
For each training example , measure the error and square it:
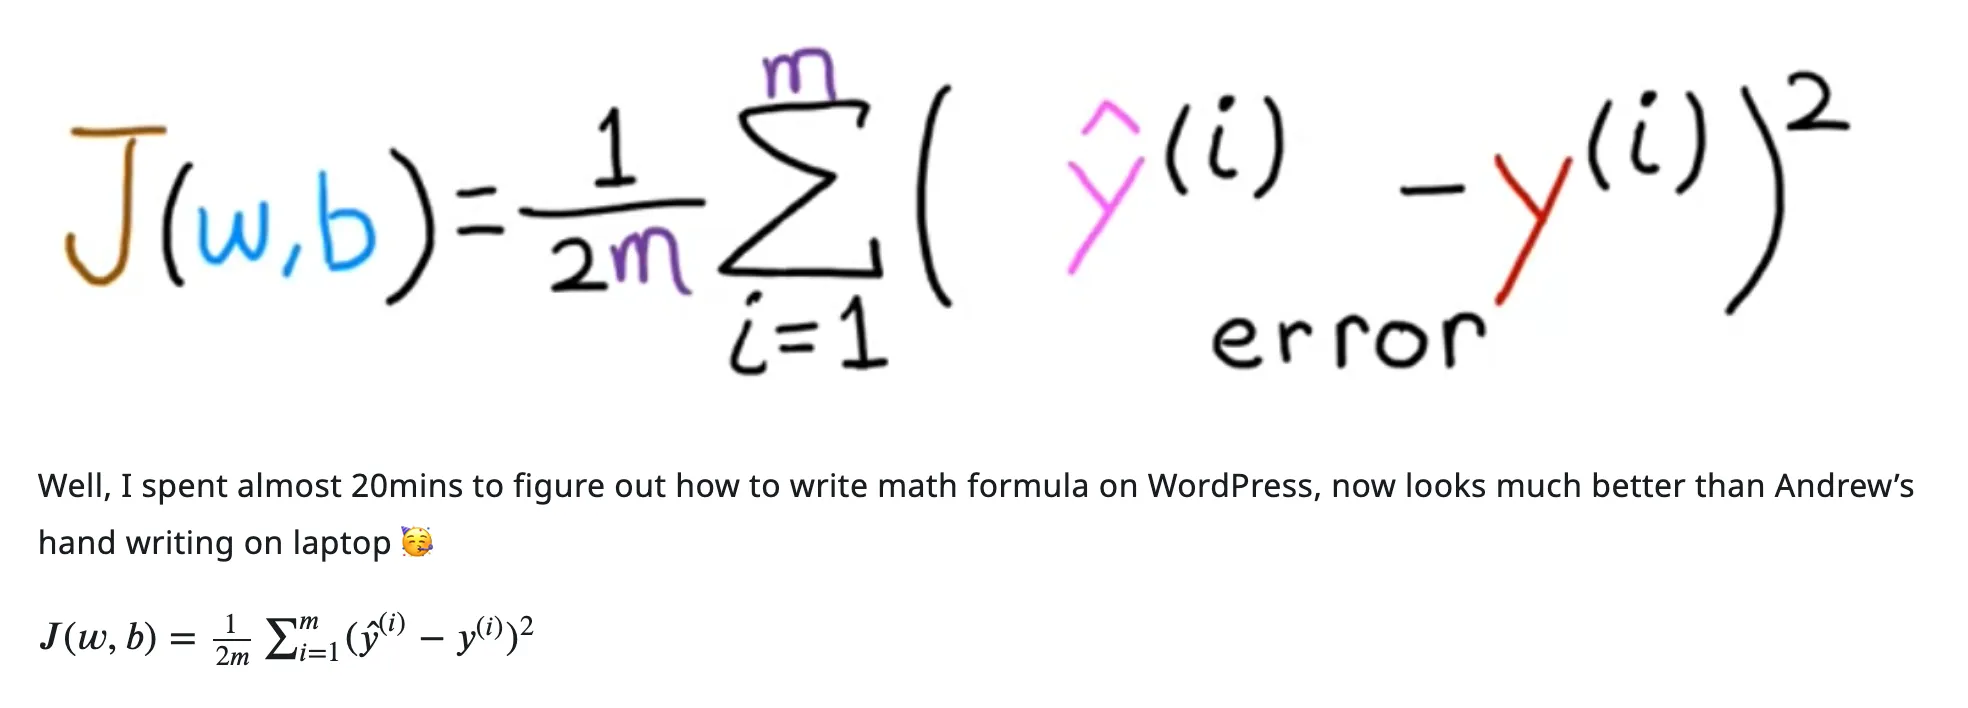
Average those squared errors over all training examples and you get the squared error cost function:
The extra division by 2 just makes some later calculations neater. The cost function works whether you include it or not.
Since , the final form is:
The goal of linear regression is to find the and that make as small as possible.
The challenging part: visualizing the cost function
“Visualizing the cost function” was the hardest part of Day 1. I watched it at least twice before I got it.
This comparison (with ) is the important one:
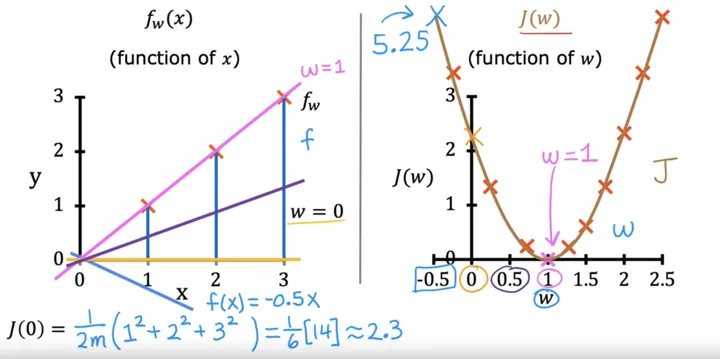
- With b = 0: J depends only on , so plotting J against gives a U-shaped parabola. The bottom of the U is the best .
- With both w and b: J becomes a 3D bowl shape (the course calls it a hammock). You can also draw it as a contour plot, like a topographical map, where each ring is a set of values with the same cost.
Terminology
| Term | Meaning |
|---|---|
| Training set | The data set used to train the model |
| Input variable / feature / input feature | Denoted as |
| Target variable | Denoted as |
| A single training example | |
| The -th training example | |
| Hypothesis | means function. Historically it was called the hypothesis. |
| (y-hat) | The estimate or prediction for y. On a Mac, press Option + i, then y, to type ŷ. |
| The target: the actual true value in the training set | |
| The error: how far the prediction is from the target | |
| Discrete category | One of a fixed set of possible classes (used in classification) |
| Univariate | ”Uni” means one in Latin. Univariate is just a fancy way of saying one variable. |
| Parameters / coefficients / weights | The variables you adjust during training to improve the model (, ) |
| Parabola curve | You know, a quadratic function |
| Hammock | The 3D bowl shape of . Have some fun… |
| Contour plot | Like a topographical map. Learning some geography while learning ML… |
| Gradient descent | One of the most important algorithms in machine learning. It and its variations train not just linear regression but some of the biggest, most complex models in AI. |
FAQ
What is supervised machine learning? It’s machine learning where the model learns from labeled examples: inputs paired with the correct outputs. After training, it predicts outputs for new inputs.
What’s the difference between regression and classification? Regression predicts a number from infinitely many possible values, like a house price. Classification predicts one category from a small, finite set, like benign or malignant.
Why does the cost function divide by 2m? Dividing by m averages the squared error over all training examples. The extra 2 only makes later calculations neater, and the cost function works with or without it.
Is unsupervised learning part of the supervised learning course? Day 1 introduces it for contrast: clustering, anomaly detection and dimensionality reduction all work on unlabeled data. The rest of this course focuses on supervised learning.
Thanks for reading! Next up is gradient descent. Check out the later days in the series below, or reach me at /contact.